


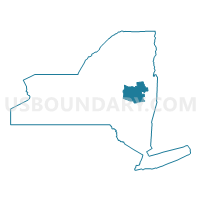
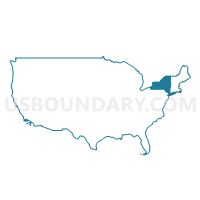
State Senate District 44, New York
About
Outline

Summary
| Unique Area Identifier | 201014 |
| Name | State Senate District 44 |
| State | New York |
| Area (square miles) | 1,649.59 |
| Land Area (square miles) | 1,581.55 |
| Water Area (square miles) | 68.04 |
| % of Land Area | 95.88 |
| % of Water Area | 4.12 |
| Latitude of the Internal Point | 43.03870180 |
| Longtitude of the Internal Point | -74.23447580 |
| Total Population | 317,410 |
| Total Housing Units | 147,382 |
| Total Households | 128,104 |
| Median Age | 40.8 |
Maps
Graphs
Select a template below for downloading or customizing gragh for State Senate District 44, New York


Neighbors
Neighoring State Legislative District Upper Chamber (by Name) Neighboring State Legislative District Upper Chamber on the Map
- State Senate District 43, NY
- State Senate District 45, NY
- State Senate District 46, NY
- State Senate District 51, NY
Top 10 Neighboring County (by Population) Neighboring County on the Map
- Albany County, NY (304,204)
- Saratoga County, NY (219,607)
- Schenectady County, NY (154,727)
- Warren County, NY (65,707)
- Herkimer County, NY (64,519)
- Otsego County, NY (62,259)
- Fulton County, NY (55,531)
- Montgomery County, NY (50,219)
- Schoharie County, NY (32,749)
- Hamilton County, NY (4,836)
Top 10 Neighboring County Subdivision (by Population) Neighboring County Subdivision on the Map
- Colonie town, Albany County, NY (81,591)
- Schenectady city, Schenectady County, NY (66,135)
- Clifton Park town, Saratoga County, NY (36,705)
- Guilderland town, Albany County, NY (35,303)
- Glenville town, Schenectady County, NY (29,480)
- Rotterdam town, Schenectady County, NY (29,094)
- Saratoga Springs city, Saratoga County, NY (26,586)
- Niskayuna town, Schenectady County, NY (21,781)
- Amsterdam city, Montgomery County, NY (18,620)
- Milton town, Saratoga County, NY (18,575)
Top 10 Neighboring Place (by Population) Neighboring Place on the Map
- Schenectady city, NY (66,135)
- Saratoga Springs city, NY (26,586)
- Rotterdam CDP, NY (20,652)
- Amsterdam city, NY (18,620)
- Gloversville city, NY (15,665)
- Johnstown city, NY (8,743)
- Scotia village, NY (7,729)
- East Glenville CDP, NY (6,616)
- Ballston Spa village, NY (5,409)
- Niskayuna CDP, NY (4,859)
Top 10 Neighboring Elementary School District (by Population) Neighboring Elementary School District on the Map
Top 10 Neighboring Unified School District (by Population) Neighboring Unified School District on the Map
- Schenectady City School District, NY (66,116)
- Shenendehowa Central School District, NY (62,406)
- Saratoga Springs City School District, NY (49,070)
- North Colonie Central School District, NY (39,534)
- South Colonie Central School District, NY (39,307)
- Guilderland Central School District, NY (36,131)
- Ballston Spa Central School District, NY (27,535)
- Amsterdam City School District, NY (25,711)
- Niskayuna Central School District, NY (23,182)
- Rotterdam-Mohonasen Central School District, NY (20,336)
Top 10 Neighboring State Legislative District Lower Chamber (by Population) Neighboring State Legislative District Lower Chamber on the Map
- Assembly District 109, NY (139,831)
- Assembly District 112, NY (139,495)
- Assembly District 110, NY (138,331)
- Assembly District 105, NY (137,005)
- Assembly District 113, NY (135,737)
- Assembly District 104, NY (132,644)
- Assembly District 127, NY (129,764)
- Assembly District 117, NY (128,680)
Top 10 Neighboring 111th Congressional District (by Population) Neighboring 111th Congressional District on the Map
- Congressional District 20, NY (683,198)
- Congressional District 21, NY (679,193)
- Congressional District 23, NY (664,245)
- Congressional District 24, NY (657,222)
Top 10 Neighboring Census Tract (by Population) Neighboring Census Tract on the Map
- Census Tract 607.02, Saratoga County, NY (9,095)
- Census Tract 619.01, Saratoga County, NY (8,977)
- Census Tract 146.07, Albany County, NY (8,262)
- Census Tract 319, Schenectady County, NY (7,442)
- Census Tract 138.01, Albany County, NY (7,278)
- Census Tract 9706, Fulton County, NY (7,117)
- Census Tract 607.01, Saratoga County, NY (7,078)
- Census Tract 218, Schenectady County, NY (6,779)
- Census Tract 324.04, Schenectady County, NY (6,737)
- Census Tract 626.02, Saratoga County, NY (6,725)
Top 10 Neighboring 5-Digit ZIP Code Tabulation Area (by Population) Neighboring 5-Digit ZIP Code Tabulation Area on the Map
- 12866, NY (36,915)
- 12020, NY (31,192)
- 12303, NY (29,857)
- 12309, NY (29,343)
- 12010, NY (28,937)
- 12302, NY (27,582)
- 12804, NY (26,540)
- 12306, NY (25,636)
- 12078, NY (23,773)
- 12110, NY (21,908)
Data
Demographic, Population, Households, and Housing Units
** Data sources from census 2010 **
Show Data on Map
Download Full List as CSV
Download Quick Sheet as CSV
| Subject | This Area | New York | National |
|---|---|---|---|
| POPULATION | |||
| Total Population Map | 317,410 | 19,378,102 | 308,745,538 |
| POPULATION, HISPANIC OR LATINO ORIGIN | |||
| Not Hispanic or Latino Map | 300,577 | 15,961,180 | 258,267,944 |
| Hispanic or Latino Map | 16,833 | 3,416,922 | 50,477,594 |
| POPULATION, RACE | |||
| White alone Map | 276,582 | 12,740,974 | 223,553,265 |
| Black or African American alone Map | 17,268 | 3,073,800 | 38,929,319 |
| American Indian and Alaska Native alone Map | 962 | 106,906 | 2,932,248 |
| Asian alone Map | 6,036 | 1,420,244 | 14,674,252 |
| Native Hawaiian and Other Pacific Islander alone Map | 148 | 8,766 | 540,013 |
| Some Other Race alone Map | 8,089 | 1,441,563 | 19,107,368 |
| Two or More Races Map | 8,325 | 585,849 | 9,009,073 |
| POPULATION, SEX | |||
| Male Map | 154,846 | 9,377,147 | 151,781,326 |
| Female Map | 162,564 | 10,000,955 | 156,964,212 |
| POPULATION, AGE (18 YEARS) | |||
| 18 years and over Map | 244,465 | 15,053,173 | 234,564,071 |
| Under 18 years | 72,945 | 4,324,929 | 74,181,467 |
| POPULATION, AGE | |||
| Under 5 years | 18,572 | 1,155,822 | 20,201,362 |
| 5 to 9 years | 19,597 | 1,163,955 | 20,348,657 |
| 10 to 14 years | 20,976 | 1,211,456 | 20,677,194 |
| 15 to 17 years | 13,800 | 793,696 | 12,954,254 |
| 18 and 19 years | 8,050 | 572,582 | 9,086,089 |
| 20 years | 3,931 | 293,083 | 4,519,129 |
| 21 years | 3,847 | 281,596 | 4,354,294 |
| 22 to 24 years | 10,878 | 836,256 | 12,712,576 |
| 25 to 29 years | 18,441 | 1,380,177 | 21,101,849 |
| 30 to 34 years | 17,714 | 1,279,160 | 19,962,099 |
| 35 to 39 years | 19,491 | 1,254,124 | 20,179,642 |
| 40 to 44 years | 21,743 | 1,355,893 | 20,890,964 |
| 45 to 49 years | 25,253 | 1,458,763 | 22,708,591 |
| 50 to 54 years | 24,958 | 1,419,928 | 22,298,125 |
| 55 to 59 years | 22,532 | 1,237,408 | 19,664,805 |
| 60 and 61 years | 8,230 | 453,993 | 7,113,727 |
| 62 to 64 years | 10,893 | 612,267 | 9,704,197 |
| 65 and 66 years | 6,006 | 330,160 | 5,319,902 |
| 67 to 69 years | 7,828 | 443,051 | 7,115,361 |
| 70 to 74 years | 9,828 | 587,391 | 9,278,166 |
| 75 to 79 years | 8,553 | 474,807 | 7,317,795 |
| 80 to 84 years | 7,671 | 391,660 | 5,743,327 |
| 85 years and over | 8,618 | 390,874 | 5,493,433 |
| MEDIAN AGE BY SEX | |||
| Both sexes Map | 40.80 | 38.00 | 37.20 |
| Male Map | 39.50 | 36.30 | 35.80 |
| Female Map | 42.10 | 39.40 | 38.50 |
| HOUSEHOLDS | |||
| Total Households Map | 128,104 | 7,317,755 | 116,716,292 |
| HOUSEHOLDS, HOUSEHOLD TYPE | |||
| Family households: Map | 82,557 | 4,649,791 | 77,538,296 |
| Husband-wife family Map | 59,827 | 3,192,903 | 56,510,377 |
| Other family: Map | 22,730 | 1,456,888 | 21,027,919 |
| Male householder, no wife present Map | 6,552 | 366,948 | 5,777,570 |
| Female householder, no husband present Map | 16,178 | 1,089,940 | 15,250,349 |
| Nonfamily households: Map | 45,547 | 2,667,964 | 39,177,996 |
| Householder living alone Map | 36,693 | 2,130,670 | 31,204,909 |
| Householder not living alone Map | 8,854 | 537,294 | 7,973,087 |
| HOUSEHOLDS, HISPANIC OR LATINO ORIGIN OF HOUSEHOLDER | |||
| Not Hispanic or Latino householder: Map | 123,221 | 6,311,241 | 103,254,926 |
| Hispanic or Latino householder: Map | 4,883 | 1,006,514 | 13,461,366 |
| HOUSEHOLDS, RACE OF HOUSEHOLDER | |||
| Householder who is White alone | 115,537 | 5,169,163 | 89,754,352 |
| Householder who is Black or African American alone | 5,915 | 1,095,790 | 14,129,983 |
| Householder who is American Indian and Alaska Native alone | 352 | 33,824 | 939,707 |
| Householder who is Asian alone | 1,885 | 445,652 | 4,632,164 |
| Householder who is Native Hawaiian and Other Pacific Islander alone | 40 | 2,615 | 143,932 |
| Householder who is Some Other Race alone | 2,398 | 405,320 | 4,916,427 |
| Householder who is Two or More Races | 1,977 | 165,391 | 2,199,727 |
| HOUSEHOLDS, HOUSEHOLD TYPE BY HOUSEHOLD SIZE | |||
| Family households: Map | 82,557 | 4,649,791 | 77,538,296 |
| 2-person household Map | 36,654 | 1,785,206 | 31,882,616 |
| 3-person household Map | 19,675 | 1,109,716 | 17,765,829 |
| 4-person household Map | 15,902 | 944,590 | 15,214,075 |
| 5-person household Map | 6,638 | 461,667 | 7,411,997 |
| 6-person household Map | 2,339 | 189,577 | 3,026,278 |
| 7-or-more-person household Map | 1,349 | 159,035 | 2,237,501 |
| Nonfamily households: Map | 45,547 | 2,667,964 | 39,177,996 |
| 1-person household Map | 36,693 | 2,130,670 | 31,204,909 |
| 2-person household Map | 7,580 | 430,564 | 6,360,012 |
| 3-person household Map | 772 | 66,787 | 992,156 |
| 4-person household Map | 339 | 24,877 | 411,171 |
| 5-person household Map | 102 | 8,596 | 126,634 |
| 6-person household Map | 28 | 3,400 | 48,421 |
| 7-or-more-person household Map | 33 | 3,070 | 34,693 |
| HOUSING UNITS | |||
| Total Housing Units Map | 147,382 | 8,108,103 | 131,704,730 |
| HOUSING UNITS, OCCUPANCY STATUS | |||
| Occupied Map | 128,104 | 7,317,755 | 116,716,292 |
| Vacant Map | 19,278 | 790,348 | 14,988,438 |
| HOUSING UNITS, OCCUPIED, TENURE | |||
| Owned with a mortgage or a loan Map | 57,070 | 2,610,123 | 52,979,430 |
| Owned free and clear Map | 31,045 | 1,287,714 | 23,006,644 |
| Renter occupied Map | 39,989 | 3,419,918 | 40,730,218 |
| HOUSING UNITS, VACANT, VACANCY STATUS | |||
| For rent Map | 3,381 | 200,039 | 4,137,567 |
| Rented, not occupied Map | 209 | 12,786 | 206,825 |
| For sale only Map | 1,770 | 77,225 | 1,896,796 |
| Sold, not occupied Map | 499 | 21,027 | 421,032 |
| For seasonal, recreational, or occasional use Map | 8,538 | 289,301 | 4,649,298 |
| For migrant workers Map | 8 | 892 | 24,161 |
| Other vacant Map | 4,873 | 189,078 | 3,652,759 |
| HOUSING UNITS, OCCUPIED, AVERAGE HOUSEHOLD SIZE BY TENURE | |||
| Total: Map | 2.42 | 2.57 | 2.58 |
| Owner occupied Map | 2.53 | 2.71 | 2.65 |
| Renter occupied Map | 2.19 | 2.41 | 2.44 |
| HOUSING UNITS, OCCUPIED, TENURE BY RACE OF HOUSEHOLDER | |||
| Owner occupied: Map | 88,115 | 3,897,837 | 75,986,074 |
| Householder who is White alone Map | 83,277 | 3,237,592 | 63,446,275 |
| Householder who is Black or African American alone Map | 1,688 | 325,395 | 6,261,464 |
| Householder who is American Indian and Alaska Native alone Map | 170 | 11,250 | 509,588 |
| Householder who is Asian alone Map | 1,181 | 197,011 | 2,688,861 |
| Householder who is Native Hawaiian and Other Pacific Islander alone Map | 19 | 741 | 61,911 |
| Householder who is Some Other Race alone Map | 873 | 74,243 | 1,975,817 |
| Householder who is Two or More Races Map | 907 | 51,605 | 1,042,158 |
| Renter occupied: Map | 39,989 | 3,419,918 | 40,730,218 |
| Householder who is White alone Map | 32,260 | 1,931,571 | 26,308,077 |
| Householder who is Black or African American alone Map | 4,227 | 770,395 | 7,868,519 |
| Householder who is American Indian and Alaska Native alone Map | 182 | 22,574 | 430,119 |
| Householder who is Asian alone Map | 704 | 248,641 | 1,943,303 |
| Householder who is Native Hawaiian and Other Pacific Islander alone Map | 21 | 1,874 | 82,021 |
| Householder who is Some Other Race alone Map | 1,525 | 331,077 | 2,940,610 |
| Householder who is Two or More Races Map | 1,070 | 113,786 | 1,157,569 |
| HOUSING UNITS, OCCUPIED, TENURE BY HISPANIC OR LATINO ORIGIN OF HOUSEHOLDER | |||
| Owner occupied: Map | 88,115 | 3,897,837 | 75,986,074 |
| Not Hispanic or Latino householder Map | 86,522 | 3,664,784 | 69,617,625 |
| Hispanic or Latino householder Map | 1,593 | 233,053 | 6,368,449 |
| Renter occupied: Map | 39,989 | 3,419,918 | 40,730,218 |
| Not Hispanic or Latino householder Map | 36,699 | 2,646,457 | 33,637,301 |
| Hispanic or Latino householder Map | 3,290 | 773,461 | 7,092,917 |
| HOUSING UNITS, OCCUPIED, TENURE BY HOUSEHOLD SIZE | |||
| Owner occupied: Map | 88,115 | 3,897,837 | 75,986,074 |
| 1-person household Map | 19,464 | 860,611 | 16,453,569 |
| 2-person household Map | 33,929 | 1,304,752 | 27,618,605 |
| 3-person household Map | 14,848 | 660,251 | 12,517,563 |
| 4-person household Map | 12,546 | 606,580 | 10,998,793 |
| 5-person household Map | 4,852 | 279,929 | 5,057,765 |
| 6-person household Map | 1,611 | 106,323 | 1,965,796 |
| 7-or-more-person household Map | 865 | 79,391 | 1,373,983 |
| Renter occupied: Map | 39,989 | 3,419,918 | 40,730,218 |
| 1-person household Map | 17,229 | 1,270,059 | 14,751,340 |
| 2-person household Map | 10,305 | 911,018 | 10,624,023 |
| 3-person household Map | 5,599 | 516,252 | 6,240,422 |
| 4-person household Map | 3,695 | 362,887 | 4,626,453 |
| 5-person household Map | 1,888 | 190,334 | 2,480,866 |
| 6-person household Map | 756 | 86,654 | 1,108,903 |
| 7-or-more-person household Map | 517 | 82,714 | 898,211 |
Loading...